The Graph (GRT) Price Today, Live Chart & Market Cap | GRT to USD Converter

The Graph GRT
Rank #136
Last updated: 2/9/2026, 12:23:29 AM · Data from CoinGecko
The Graph (GRT) Price Today
The Graph Price Analysis
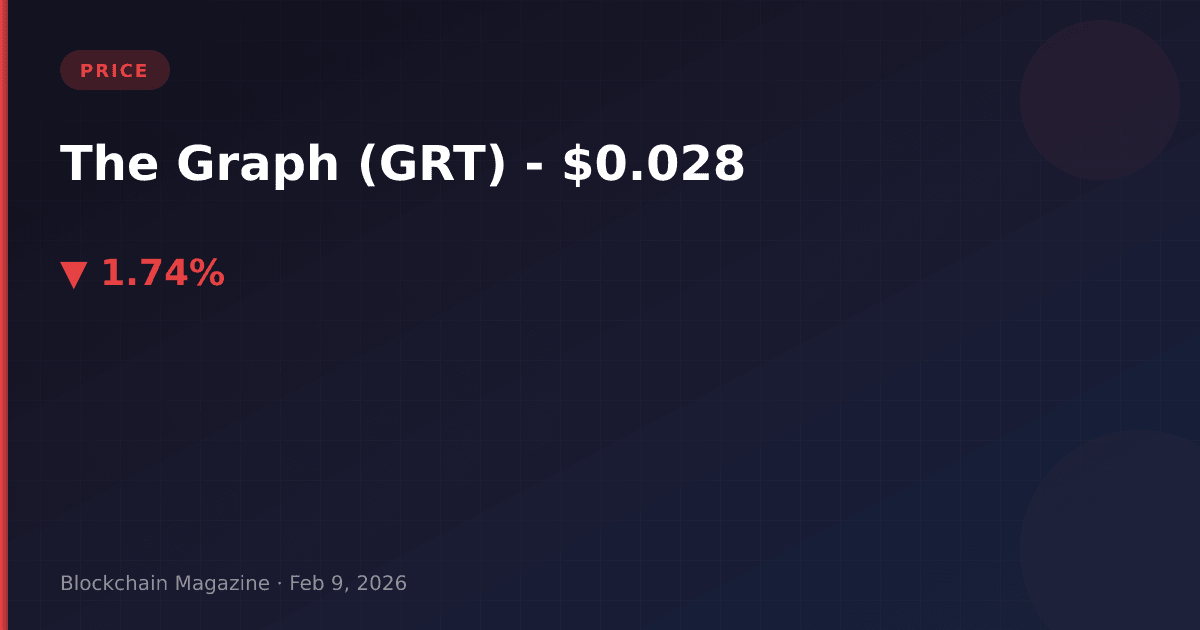
The Graph (GRT) is currently trading at $0.02767227, representing a -1.74% decline over the past 24 hours. The token has experienced significant downward pressure across multiple timeframes, with a -7.62% loss over the past week and a substantial -33.99% drop over the last 30 days. This bearish momentum reflects broader market conditions and potential concerns about indexing protocol adoption rates.
With a market capitalization of $296.30 million, The Graph maintains its position as the #136 ranked cryptocurrency by market cap. The current price sits precariously close to its all-time low of $0.02343952, just 18.06% above this critical support level. Meanwhile, GRT remains 97.26% below its all-time high of $2.84, highlighting the severe correction the asset has undergone since its peak valuation.
Trading volume stands at $10.58 million over the past 24 hours, indicating moderate liquidity but lower trading interest compared to previous periods. The circulating supply of 10.71 billion GRT tokens represents 99.17% of the maximum supply of 10.80 billion, suggesting minimal future dilution concerns. Investors should monitor key support levels and broader Web3 infrastructure adoption trends when evaluating GRT’s near-term price trajectory.
Technical Overview: The Graph Network
The Graph is a decentralized indexing protocol for querying blockchain data, often described as the “Google of blockchains.” The protocol enables developers to build and publish open APIs called subgraphs, making blockchain data easily accessible for decentralized applications (dApps). GRT serves as the native utility token powering the network’s economic model, used for query fees, indexing rewards, and governance.
The Graph network operates through three key participant roles: Indexers (who stake GRT tokens to provide indexing and query processing services), Curators (who signal on valuable subgraphs by staking GRT), and Delegators (who delegate their GRT to Indexers to earn rewards). This tri-party system creates a decentralized marketplace for blockchain data indexing.
Currently, The Graph supports indexing data from multiple blockchain networks including Ethereum, Polygon, Arbitrum, Optimism, Avalanche, Celo, and more. The protocol has indexed hundreds of billions of queries since launch and powers major dApps like Uniswap, Synthetix, and Decentraland. The network’s tokenomics include an inflationary reward mechanism for indexers balanced by query fee burning, creating dynamic supply economics.
From a technical analysis perspective, GRT is testing critical support zones near its all-time low. The Relative Strength Index (RSI) suggests oversold conditions, though sustained downtrends require confirmation of reversal patterns before establishing long positions. The token’s correlation with broader Web3 infrastructure sentiment makes it sensitive to developer activity metrics and dApp ecosystem growth.
The Graph (GRT) Price Prediction 2024-2025
Predicting The Graph’s price trajectory requires analyzing both protocol fundamentals and macroeconomic factors affecting the cryptocurrency market. Based on current data and market positioning, here are data-driven scenarios for GRT’s potential price movement:
Short-Term Outlook (3-6 Months)
In the near term, GRT faces significant technical resistance. The token must first reclaim the $0.035-$0.040 range to signal any meaningful reversal from its current downtrend. The proximity to the all-time low of $0.02343952 presents both risk and opportunity—a break below this level could trigger additional selling pressure toward $0.020-$0.022, while a successful defense could establish a double-bottom formation. Conservative estimates suggest a trading range of $0.024-$0.038 for Q2-Q3 2024, assuming stable market conditions.
Medium-Term Projection (6-12 Months)
The medium-term outlook depends heavily on Web3 adoption metrics and network growth. If The Graph successfully onboards additional blockchain networks and increases query volume by 40-60%, price appreciation to $0.055-$0.085 becomes feasible. This represents a potential 100-200% gain from current levels. Key catalysts include Ethereum ecosystem expansion, increased subgraph deployment, and integration with major DeFi protocols. Conversely, continued bearish crypto market sentiment could keep GRT range-bound between $0.025-$0.045.
Long-Term Potential (2025 and Beyond)
Long-term price predictions for The Graph are inherently tied to the decentralized data indexing market growth. If Web3 achieves mainstream adoption and The Graph maintains its position as the leading indexing solution, GRT could challenge previous resistance levels. Bull case scenarios project $0.15-$0.25 by late 2025, requiring substantial market cap growth and protocol revenue increases. The bear case maintains $0.035-$0.060 as GRT struggles with competition and market saturation. Realistic mid-range expectations place GRT at $0.08-$0.12, representing approximately 3-4x returns from current prices, contingent on sustained protocol development and crypto market recovery.
Important Risk Factors: These predictions assume no catastrophic protocol failures, continued development funding, and reasonable market conditions. Investors should consider that 97% drawdown from ATH indicates extreme volatility risk. Network growth metrics, Indexer participation rates, and query volume statistics should be monitored as leading indicators of price direction.
How to Buy The Graph (GRT)
Purchasing The Graph (GRT) tokens is straightforward through major cryptocurrency exchanges. Here’s a step-by-step guide:
- Choose an Exchange: GRT is listed on major platforms including Coinbase, Binance, Kraken, Huobi, and KuCoin. Select an exchange based on your location, fees, and preferred payment methods.
- Create and Verify Your Account: Complete the registration process and finish KYC (Know Your Customer) verification by submitting identification documents as required by your chosen exchange.
- Deposit Funds: Add funds to your exchange account via bank transfer, credit/debit card, or by depositing cryptocurrency like Bitcoin or USDT that you already own.
- Search for GRT: Navigate to the exchange’s trading interface and search for “GRT” or “The Graph.” Select the trading pair (typically GRT/USD, GRT/USDT, or GRT/BTC).
- Place Your Order: Choose between a market order (instant purchase at current price) or limit order (buy at a specific target price). Enter the amount of GRT you wish to purchase and confirm the transaction.
- Secure Your Tokens: For long-term holding, consider transferring your GRT to a hardware wallet (Ledger, Trezor) or a non-custodial wallet like MetaMask for enhanced security.
Pro tip: GRT holders can participate in network activities by delegating tokens to Indexers through The Graph’s official portal to earn staking rewards.
The Graph Market Statistics
Price Information
- Current Price: $0.02767227
- 24h Change: -1.74%
- 7d Change: -7.62%
- 30d Change: -33.99%
Market Data
- Market Cap Rank: #136
- Market Capitalization: $296.30M
- 24h Trading Volume: $10.58M
- Volume/Market Cap: 3.57%
Supply Information
- Circulating Supply: 10.71B GRT
- Max Supply: 10.80B GRT
- Supply Circulating: 99.17%
- Tokens Until Max: 90M GRT
Historical Data
- All-Time High: $2.84
- ATH Distance: -97.26%
- All-Time Low: $0.02343952
- ATL Distance: +18.06%
Should You Invest in The Graph?
Bullish Arguments for GRT
- Critical Infrastructure: The Graph provides essential indexing services for the Web3 ecosystem, positioning it as foundational infrastructure
- Growing Network Usage: Hundreds of billions of queries served demonstrate real-world utility and adoption
- Multi-Chain Expansion: Support for multiple blockchain networks increases addressable market and reduces platform risk
- Near Maximum Supply: With 99.17% of tokens already in circulation, future dilution concerns are minimal
- Oversold Technical Position: Trading near all-time lows may present accumulation opportunities for long-term investors
Bearish Risk Factors
- Severe Price Decline: 97% drawdown from ATH indicates extreme volatility and significant investor losses
- Negative Momentum: Continued losses across all timeframes (24h, 7d, 30d) suggest bearish trend continuation
- Competition: Centralized alternatives and competing decentralized protocols pose market share threats
- Low Trading Volume: $10.58M daily volume suggests reduced market interest and liquidity concerns
- Market Dependency: GRT’s price closely correlates with overall crypto market sentiment and Web3 adoption rates
Investment Recommendation: The Graph represents a high-risk, high-reward opportunity best suited for investors who believe in Web3’s long-term potential. The current price near all-time lows may offer attractive entry points for dollar-cost averaging strategies, but investors should only allocate capital they can afford to lose. Position sizing of 1-3% of a crypto portfolio is advisable given the volatility profile. Monitoring network growth metrics and query volume is essential for ongoing investment decisions.
Stay informed with daily updates from Blockchain Magazine on Google News. Click here to follow us and mark as favorite: [Blockchain Magazine on Google News].
Disclaimer
Blockchain Magazine publishes content submitted by third-party agencies, partners, and clients. Any such posts are categorized and tagged accordingly:
- Sponsored Content: Posts labeled as "Sponsored" are paid placements submitted by third-party agencies or clients. Blockchain Magazine does not endorse or express any views regarding the information contained in these posts. The opinions expressed belong solely to the respective authors and do not reflect the official policy or position of Blockchain Magazine.
- Press Releases: Posts labeled as "Press Release" are paid PR submissions provided by our partners and clients. These are published as received and should be considered as promotional content.
The information provided in such posts is strictly for informational purposes only and should not be interpreted as financial, investment, or professional advice. Blockchain Magazine does not recommend, endorse, or promote any specific products, services, or companies mentioned. Readers are strongly encouraged to conduct independent research and consult with a qualified professional before making any financial or investment decisions.
Additionally, all featured images accompanying such posts are intended as creative depictions of the subject matter. There is no intent to offend or misrepresent any individual, institution, or entity. If any content or imagery is found to be objectionable, please reach out to us at [email protected], and we will promptly review the concern.
About the Author: Editors Desk



Get Blockchain Insights In Inbox
Stay ahead of the curve with expert analysis and market updates.