

Crypto Heat Map Reveals Hidden Gems: Where to Invest Before the Next Boom
The cryptocurrency market is a dynamic and ever-evolving landscape, where opportunities for profit often lie hidden beneath the surface. While major cryptocurrencies like Bitcoin and Ethereum dominate headlines, savvy investors know that the next big boom could come from lesser-known tokens. A crypto heat map, a visual tool that highlights the performance of various cryptocurrencies, can be an invaluable resource for uncovering these hidden gems. This article explores how to use a crypto heat map to identify promising investment opportunities and position yourself ahead of the next market surge.
Understanding the Crypto Heat Map
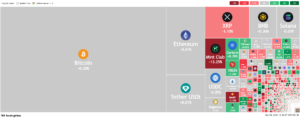
A crypto heat map is a graphical representation of the cryptocurrency market, where each token is represented by a colored tile. The color of each tile corresponds to the token’s performance over a specific period, typically ranging from green (indicating positive performance) to red (indicating negative performance). The size of the tile often reflects the token’s market capitalization, providing a quick overview of its relative importance in the market.
Heat maps are particularly useful for identifying trends and patterns that may not be immediately apparent. For example, a cluster of green tiles in a specific sector, such as decentralized finance (DeFi) or non-fungible tokens (NFTs), could indicate a growing interest in that area. By analyzing these patterns, investors can gain insights into where the market is heading and which tokens are likely to benefit from the next wave of growth.
The Role of Market Sentiment in Heat Map Analysis
Market sentiment plays a crucial role in the performance of cryptocurrencies, and heat maps can help investors gauge this sentiment. When a particular sector or token shows consistent positive performance on the heat map, it often reflects strong investor confidence and optimism. Conversely, a cluster of red tiles may indicate waning interest or negative sentiment.
However, it is essential to look beyond the surface and consider the underlying factors driving these trends. For instance, a token may show positive performance due to a recent partnership, technological breakthrough, or favorable regulatory developments. By combining heat map analysis with a deeper understanding of market dynamics, investors can make more informed decisions.
Identifying Hidden Gems: Key Indicators to Watch
While heat maps provide a broad overview of the market, identifying hidden gems requires a more nuanced approach. Here are some key indicators to consider when analyzing a crypto heat map:
Sector Performance
Certain sectors within the cryptocurrency market, such as DeFi, NFTs, and blockchain interoperability, have shown significant growth potential. A heat map can reveal which sectors are currently performing well and which ones may be poised for future growth. For example, if the DeFi sector is consistently green on the heat map, it may indicate a broader trend toward decentralized financial solutions.
Token Utility and Adoption
The utility of a token and its level of adoption are critical factors in determining its long-term success. Tokens that solve real-world problems or offer unique features are more likely to gain traction. A heat map can help identify tokens that are gaining attention, but it is essential to research their use cases and adoption rates. For instance, a token with a strong use case in cross-border payments may have higher growth potential than one with a vague or speculative purpose.
Market Capitalization and Liquidity
Market capitalization and liquidity are important considerations when evaluating potential investments. While large-cap tokens like Bitcoin and Ethereum are generally considered safer investments, small-cap tokens can offer higher returns due to their growth potential. A heat map can help identify small-cap tokens that are showing positive performance, but it is crucial to assess their liquidity to ensure that you can enter and exit positions easily.
Technical Analysis
Technical analysis involves studying price charts and using indicators to predict future price movements. A heat map can complement technical analysis by highlighting tokens that are showing strong momentum or breaking out of key resistance levels. For example, a token that is consistently green on the heat map and showing a bullish pattern on its price chart may be a strong candidate for investment.
Case Study: Using a Heat Map to Identify a Hidden Gem
To illustrate the power of heat map analysis, let’s examine a hypothetical case study. In early 2023, a crypto heat map revealed a cluster of green tiles in the blockchain interoperability sector. Upon further investigation, it was discovered that a particular token, designed to facilitate seamless communication between different blockchains, was gaining significant attention due to its innovative technology and growing list of partnerships.
Investors who recognized this trend early were able to position themselves ahead of the token’s price surge. As the token gained adoption and its utility became more apparent, its value increased significantly, resulting in substantial profits for those who had invested during the early stages.
This case study highlights the importance of combining heat map analysis with thorough research and a deep understanding of market dynamics. By identifying emerging trends and evaluating the underlying factors driving them, investors can uncover hidden gems and capitalize on the next market boom.
Risk Management: Navigating the Volatility of Hidden Gems
While hidden gems offer the potential for high returns, they also come with increased risk. The cryptocurrency market is notoriously volatile, and small-cap tokens can experience significant price swings. Effective risk management is essential for navigating this volatility and protecting your investments.
Diversification is one of the most effective risk management strategies. By spreading your investments across multiple tokens and sectors, you can reduce the impact of any single token’s poor performance on your overall portfolio. Additionally, setting stop-loss orders can help limit potential losses, while take-profit orders allow you to lock in gains.
It is also important to stay informed and adapt to changing market conditions. Regularly reviewing your portfolio and adjusting your strategy based on new information can help you stay ahead of the curve and minimize risks.
Summing Up
Crypto heat maps are powerful tools for uncovering hidden gems and identifying promising investment opportunities. By analyzing sector performance, token utility, market capitalization, and technical indicators, investors can gain valuable insights into where the market is heading and which tokens are likely to benefit from the next boom.
However, success in the cryptocurrency market requires more than just following a heat map. It demands thorough research, a deep understanding of market dynamics, and effective risk management. By combining these elements, you can unlock the full potential of crypto heat maps and position yourself for success in the ever-evolving world of cryptocurrency.
Stay informed with daily updates from Blockchain Magazine on Google News. Click here to follow us and mark as favorite: [Blockchain Magazine on Google News].
Disclaimer
Blockchain Magazine publishes content submitted by third-party agencies, partners, and clients. Any such posts are categorized and tagged accordingly:
- Sponsored Content: Posts labeled as "Sponsored" are paid placements submitted by third-party agencies or clients. Blockchain Magazine does not endorse or express any views regarding the information contained in these posts. The opinions expressed belong solely to the respective authors and do not reflect the official policy or position of Blockchain Magazine.
- Press Releases: Posts labeled as "Press Release" are paid PR submissions provided by our partners and clients. These are published as received and should be considered as promotional content.
The information provided in such posts is strictly for informational purposes only and should not be interpreted as financial, investment, or professional advice. Blockchain Magazine does not recommend, endorse, or promote any specific products, services, or companies mentioned. Readers are strongly encouraged to conduct independent research and consult with a qualified professional before making any financial or investment decisions.
Additionally, all featured images accompanying such posts are intended as creative depictions of the subject matter. There is no intent to offend or misrepresent any individual, institution, or entity. If any content or imagery is found to be objectionable, please reach out to us at [email protected], and we will promptly review the concern.
About the Author: Peter Raid



Get Blockchain Insights In Inbox
Stay ahead of the curve with expert analysis and market updates.